EcomBack 2025 ADA Website Accessibility Lawsuits Annual Report
EcomBack 2025 ADA Website
Accessibility
Lawsuits
Annual Report
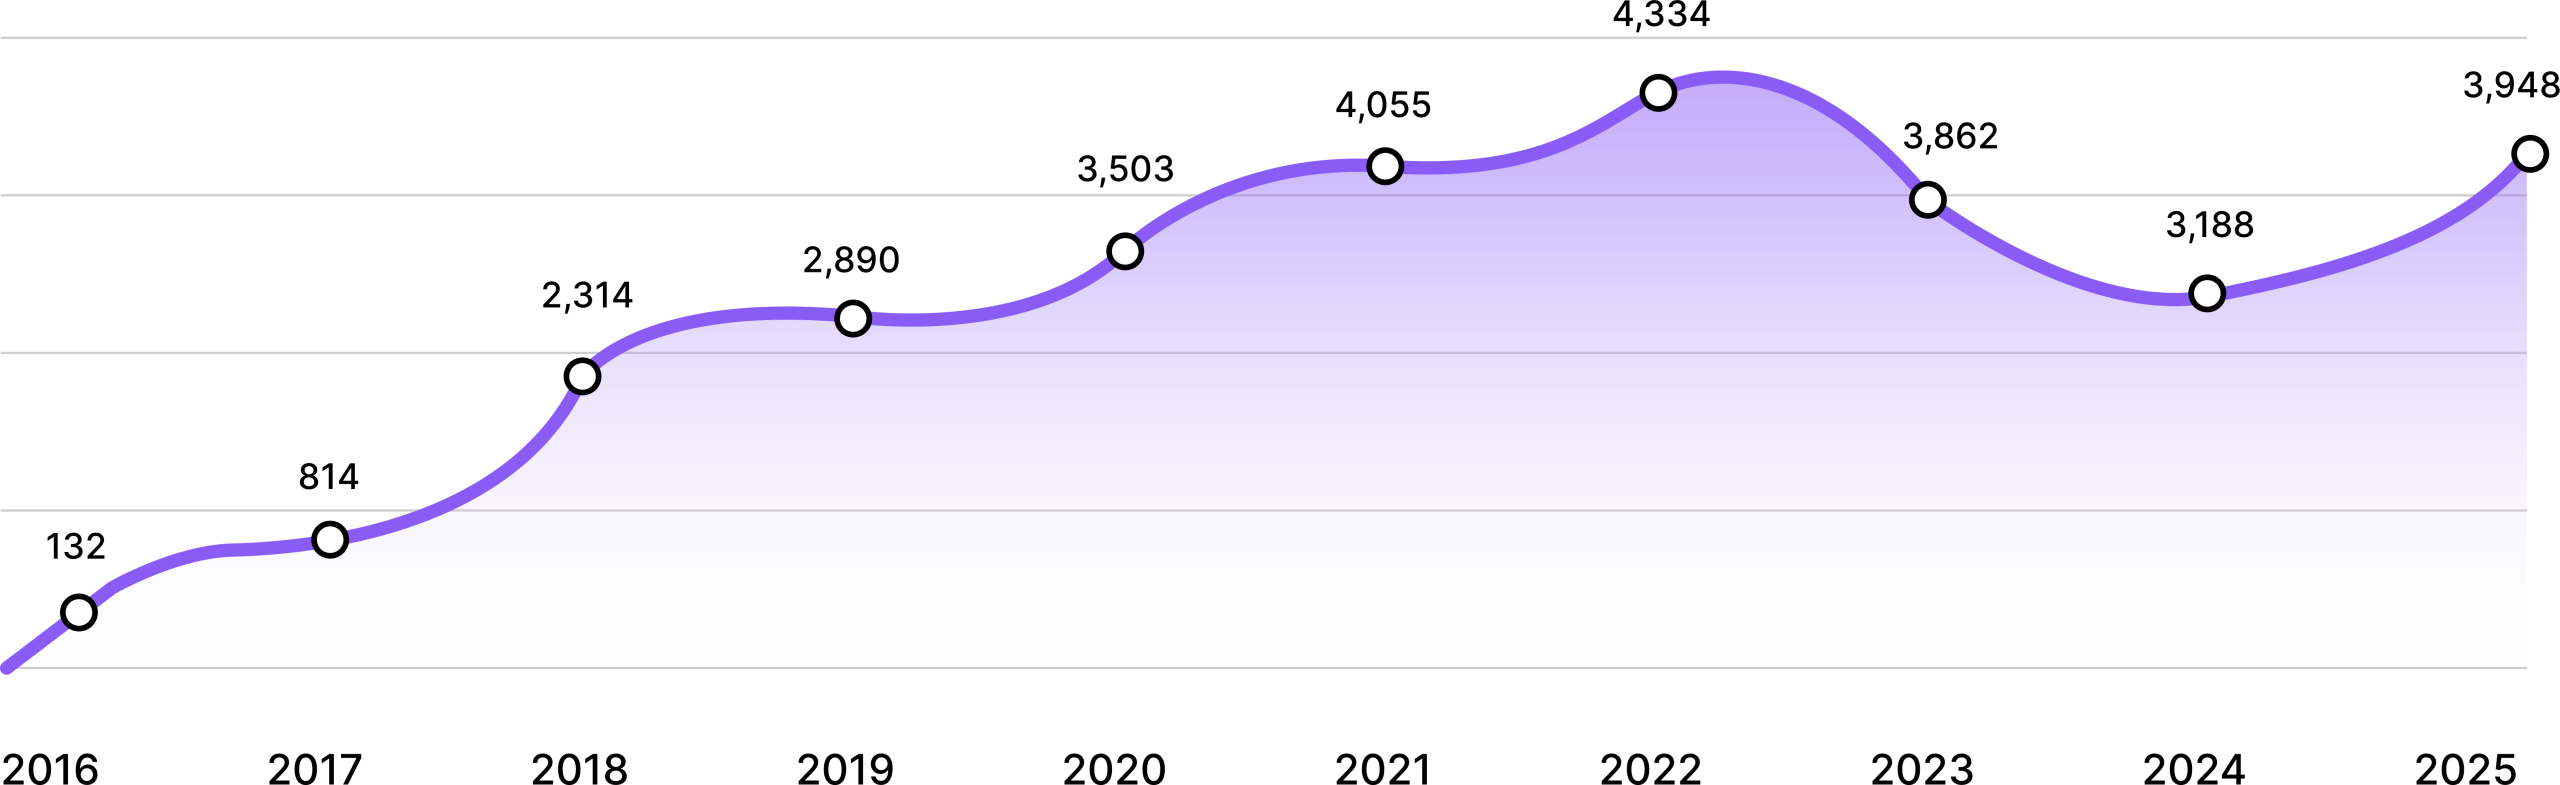
Graph description showing the growth of lawsuits filed from 2016 to 2025
The graph shows the total number of ADA website accessibility lawsuits filed each year from 2016 through 2025. Filings rose from 132 (2016) to 814 (2017), then increased sharply to 2,314 (2018) and 2,890 (2019). The upward trend continued through 3,503 (2020), 4,055 (2021), and peaked at 4,334 (2022). After that peak, filings declined to 3,862 (2023) and 3,188 (2024), before rebounding to 3,948 (2025). Overall, the trend shows strong long-term growth, with a dip after 2022 followed by an increase in 2025.
3,948 ADA website lawsuits filed from January – December 2025
3,948 ADA website lawsuits filed from
January – December 2025
ADA Web Accessibility Lawsuits
EcomBack’s 2025 ADA Website Accessibility Lawsuit Report highlights critical trends, data insights, and key takeaways from a year marked by continued scrutiny of digital accessibility compliance. A total of 3,948 lawsuits were filed, which is 23.84% higher than 2024 (3,188). This report provides a clear snapshot of the major contributors, high-activity states, repeat filers, plaintiff firms, targeted industries, and the growing role of accessibility widgets and platform patterns in an evolving legal landscape.
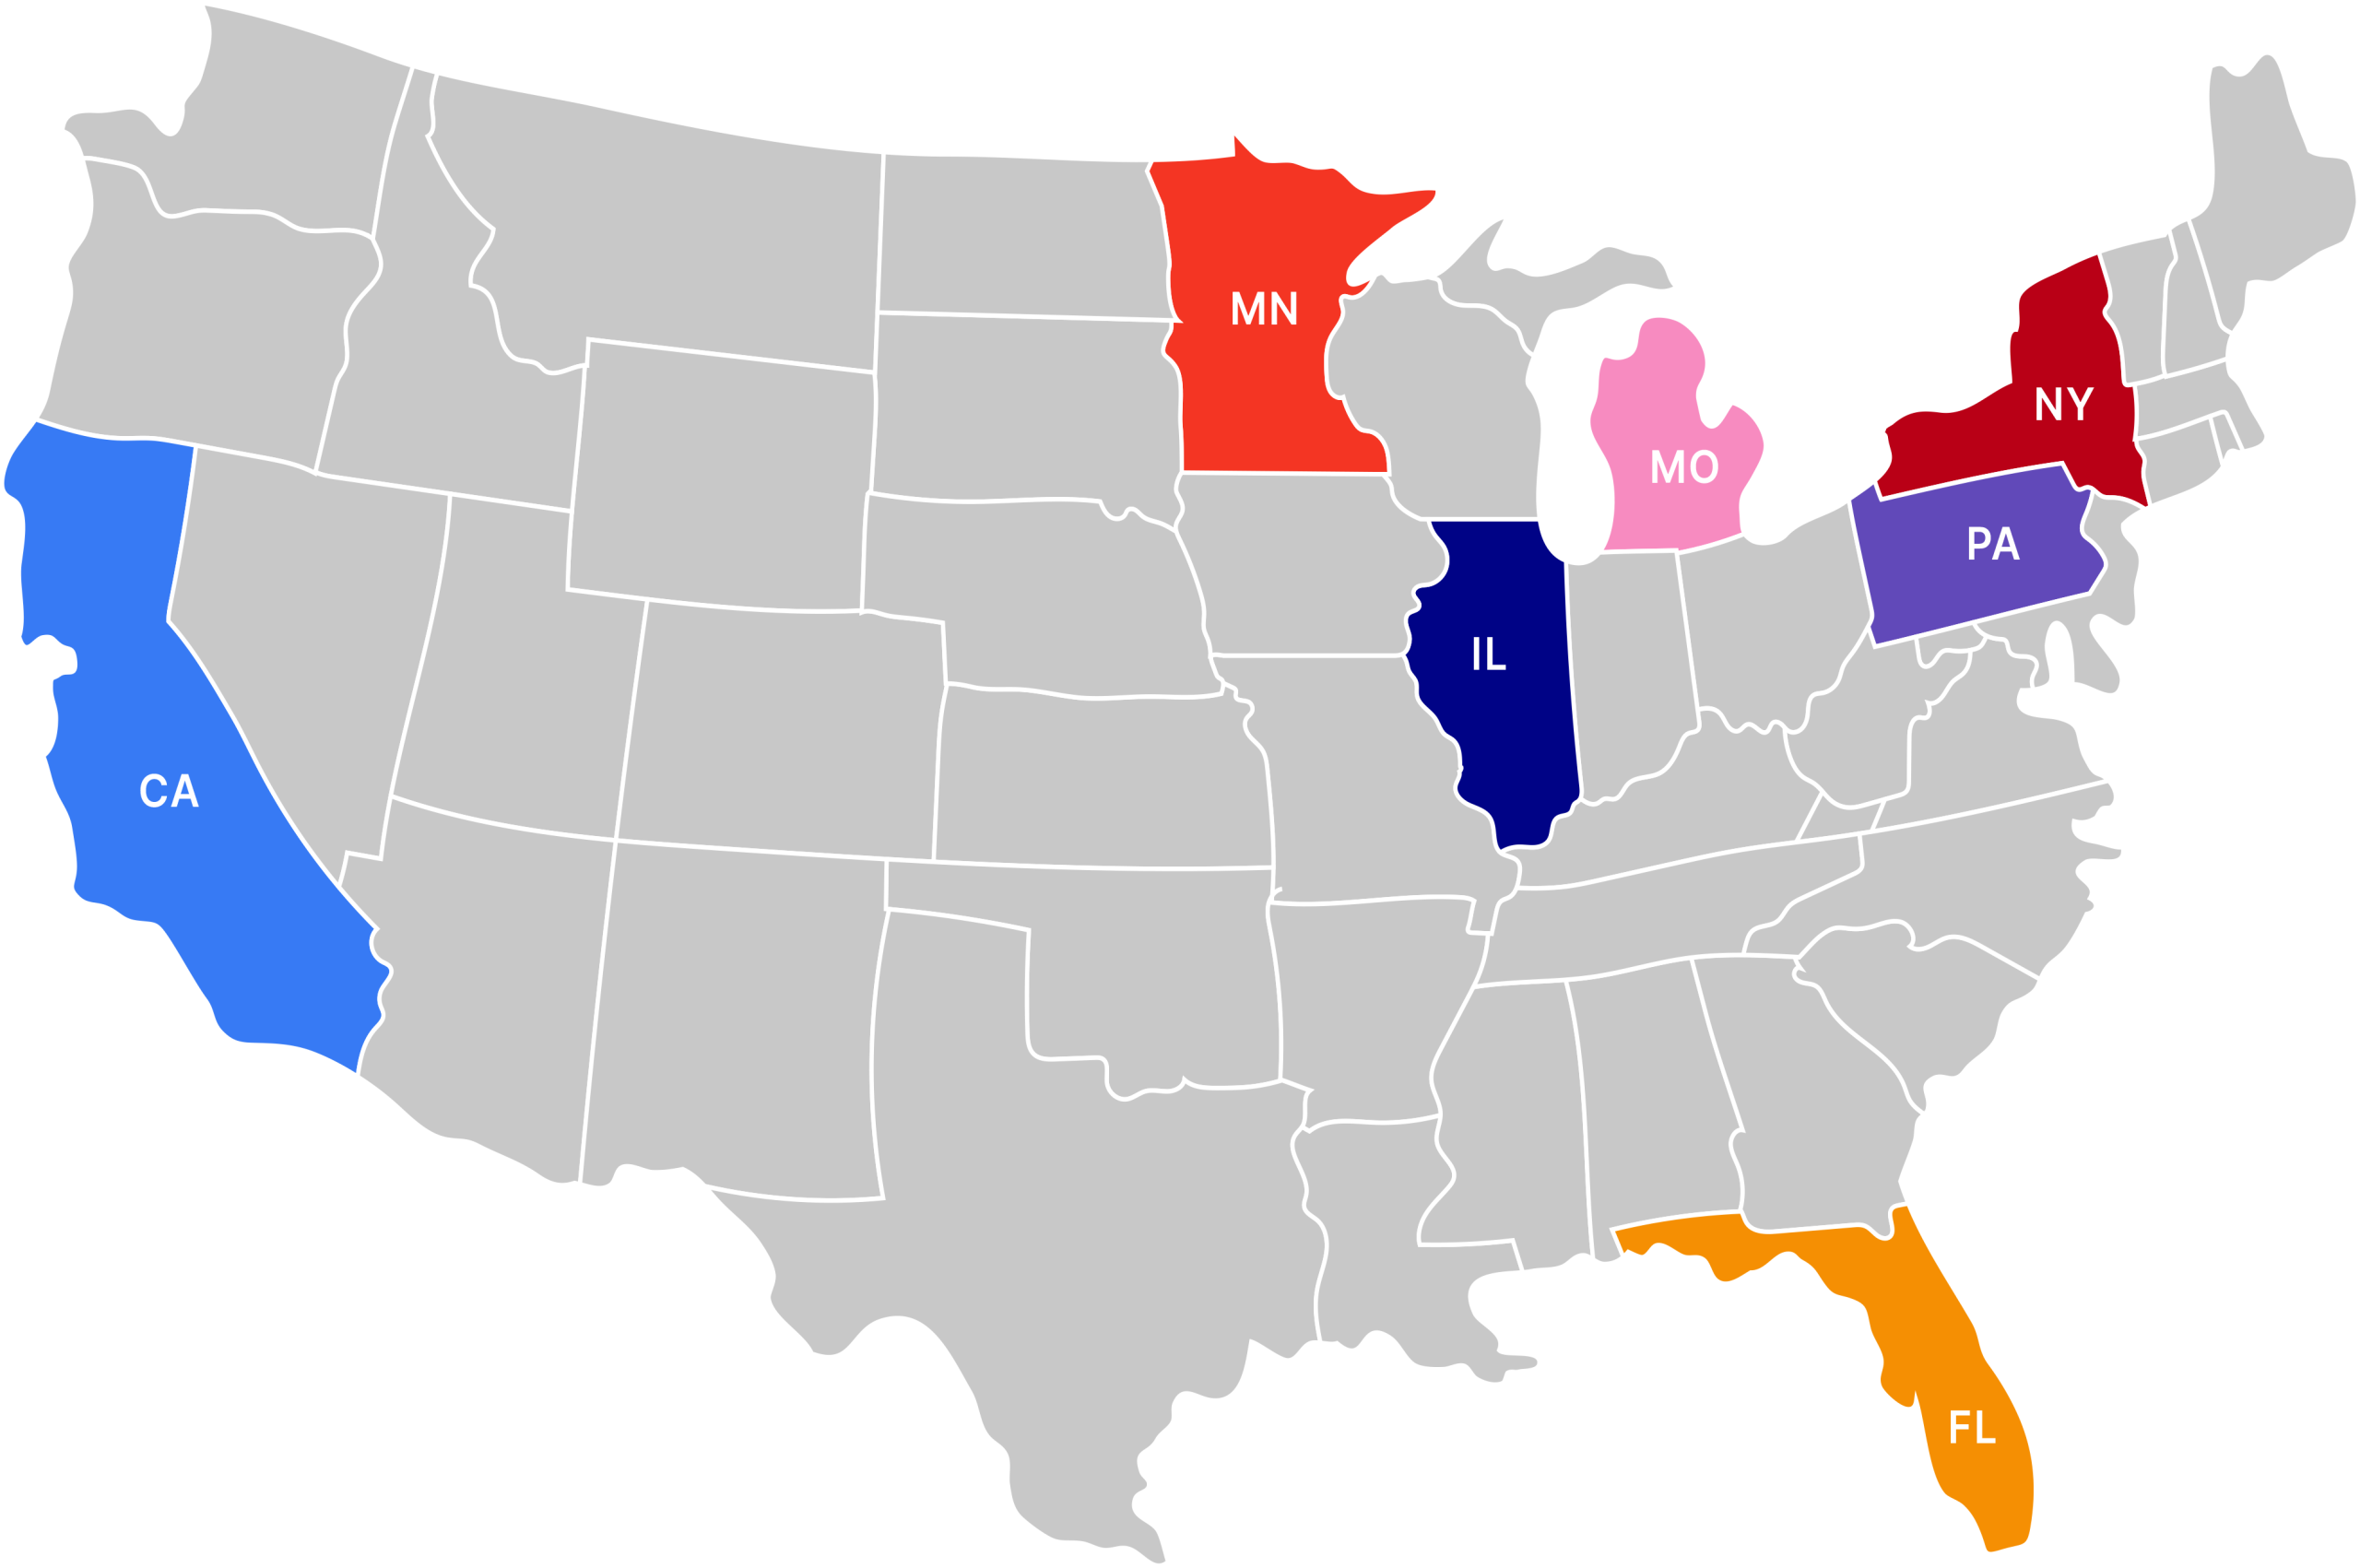
State-wise Breakdown
New York: 1,108 Lawsuits (28.06%)
Florida: 950 Lawsuits (24.06%)
California: 787 Lawsuits (19.93%)
Illinois: 576 Lawsuits (14.59%)
Minnesota: 160 Lawsuits (4.05%)
Pennsylvania: 101 Lawsuits (2.56%)
Missouri: 85 Lawsuits (2.15%)
All Other States: 181 Lawsuits (4.58%)

ADA Web Accessibility Lawsuits
EcomBack’s 2025 ADA Website Accessibility Lawsuit Report highlights critical trends, data insights, and key takeaways from a year marked by continued scrutiny of digital accessibility compliance. A total of 3,948 lawsuits were filed, which is 23.84% higher than 2024 (3,188). This report provides a clear snapshot of the major contributors, high-activity states, repeat filers, plaintiff firms, targeted industries, and the growing role of accessibility widgets and platform patterns in an evolving legal landscape.
State-wise Breakdown
New York: 1,108 Lawsuits (28.06%)
Florida: 950 Lawsuits (24.06%)
California: 787 Lawsuits (19.93%)
Illinois: 576 Lawsuits (14.59%)
Minnesota: 160 Lawsuits (4.05%)
Pennsylvania: 101 Lawsuits (2.56%)
Missouri: 85 Lawsuits (2.15%)
All Other States: 181 Lawsuits (4.58%)
Key Findings

State-wise Analysis
- New York, Florida, and California remained the most active states, with 1,108 (28.06%), 950 (24.06%), and 787 (19.93%) lawsuits filed in 2025
- Together, these states accounted for 72.06% of all filings, while Illinois added 576 (14.59%), bringing the top four to 86.65%
Plaintiff Trends
- 251 plaintiffs filed 3,948 ADA website lawsuits in 2025, with 33 plaintiffs responsible for 50.10% of all cases (1,978 lawsuits)
- The most active plaintiff was Michael Sandoval, filing 241 lawsuits (6.10%)
Plaintiff Firms
- 16 plaintiff firms filed 3,567 lawsuits (90.35%), showing extreme concentration among a small number of repeat firms
- Equal Access Law Group, PLLC led with 641 lawsuits (16.24%), followed closely by Manning Law, APC with 615 (15.58%)
Industry Trends
- The top 9 industries accounted for 3,613 lawsuits (91.51%), confirming sustained targeting of consumer-facing sectors
- Restaurant, Food, Drinks & Beverages ranked first with 1,368 (34.65%), followed by Lifestyle, Fashion, Clothing & Apparel with 1,025 (25.96%)
Accessibility Widgets
- 983 lawsuits (24.90%) were filed against websites using accessibility widgets in 2025, reinforcing that widgets do not prevent litigation when core barriers remain
- Widget-related filings were concentrated: the top 5 widget providers accounted for 869 of 983 widget-related lawsuits (88.40%)
Platform Trends
Lawsuits continued to cluster around widely used platforms and custom builds, driven by implementation quality rather than the platform itself
Annual Comparison of ADA Website Lawsuits: 2025 vs. 2024
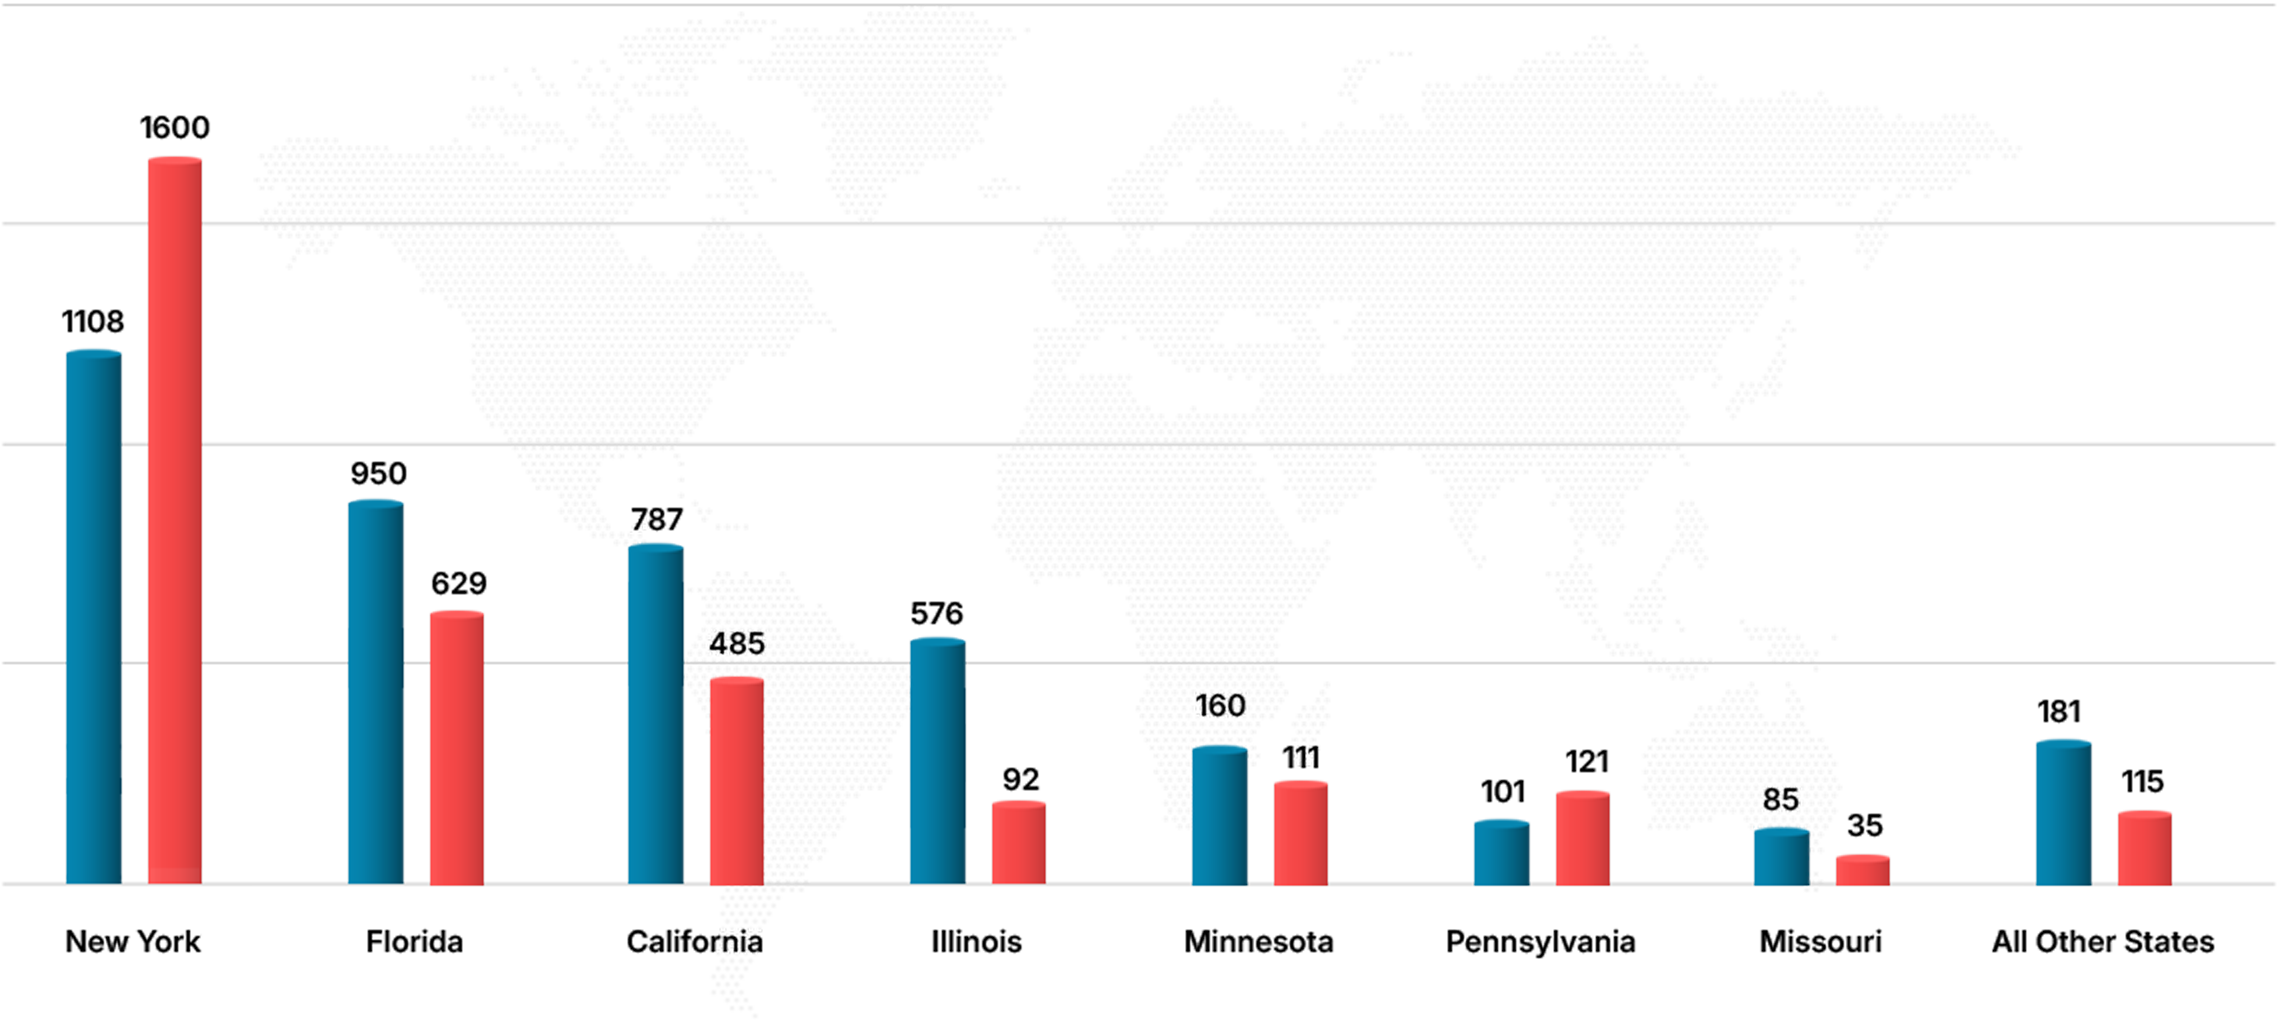
Chart description for State-wise Annual Comparison of ADA Website Lawsuits: 2025 vs. 2024
Bar chart comparing ADA website accessibility lawsuit filings by state in 2025 (blue) versus 2024 (red). The counts shown are: New York: 1,108 in 2025 vs 1,600 in 2024; Florida: 950 vs 629; California: 787 vs 485; Illinois: 576 vs 92; Minnesota: 160 vs 111; Pennsylvania: 101 vs 121; Missouri: 85 vs 35; and All Other States: 181 vs 115.
This comparison highlights where 2025 filing volume moved, not just where it remained concentrated. New York stayed the highest-volume jurisdiction but recorded a notable year-over-year decline, while several other high-activity states expanded sharply and drove the national increase.
Key shifts shown in the chart:
- New York: filings fell meaningfully year over year, even though it remained the largest venue by volume
- Growth states: Florida, California, and especially Illinois increased significantly, indicating filing momentum spread beyond a single dominant state
- Mid-volume movement: Minnesota and Missouri rose, while Pennsylvania dipped slightly, suggesting smaller but measurable shifts in where cases are filed
- All other states: the “All Other States” category increased, reinforcing the broader trend that 2025 activity was distributed across more jurisdictions
Overall, the chart reflects a wider geographic dispersion of ADA website accessibility filings in 2025, with growth concentrated in a handful of high-volume states while activity also expanded beyond the top venues.
ADA Website Lawsuits Filed by State in 2025
| State-wise ADA Website Lawsuits Filed | Total Lawsuits | Percentage | Jan | Feb | Mar | Apr | May | Jun | Jul | Aug | Sep | Oct | Nov | Dec |
|---|---|---|---|---|---|---|---|---|---|---|---|---|---|---|
| New York | 1,108 | 28.06% | 128 | 127 | 122 | 86 | 109 | 66 | 94 | 79 | 68 | 101 | 69 | 59 |
| Florida | 950 | 24.06% | 62 | 57 | 113 | 78 | 106 | 73 | 104 | 62 | 72 | 79 | 67 | 77 |
| California | 787 | 19.93% | 44 | 56 | 62 | 93 | 84 | 64 | 77 | 58 | 78 | 73 | 49 | 49 |
| Illinois | 576 | 14.59% | 41 | 42 | 35 | 37 | 53 | 29 | 70 | 73 | 60 | 53 | 47 | 36 |
| Minnesota | 160 | 4.05% | 11 | 12 | 16 | 17 | 14 | 14 | 14 | 15 | 16 | 13 | 11 | 7 |
| Pennsylvania | 101 | 2.56% | 4 | 20 | 0 | 1 | 2 | 20 | 22 | 9 | 0 | 0 | 2 | 21 |
| Missouri | 85 | 2.15% | 11 | 3 | 0 | 9 | 10 | 15 | 5 | 9 | 5 | 9 | 3 | 6 |
| All Other States | 181 | 4.58% | 17 | 19 | 21 | 11 | 15 | 11 | 16 | 6 | 11 | 20 | 28 | 6 |
| Total ADA Lawsuits Filed | 3,948 | 100% | 318 | 336 | 369 | 332 | 393 | 292 | 402 | 311 | 310 | 348 | 276 | 261 |
Monthly filing activity in 2025 showed clear peaks in late spring and mid-summer, with the highest totals recorded in May and July. Volumes softened toward year-end, with November and December among the lowest months. This pattern suggests sustained year-round filing activity, with predictable surges that businesses should account for in monitoring and remediation planning.
State-wise Comparison
(Counts and Change)
| Annual Comparison: 2025 vs. 2024 | 2025 | 2024 | Count | Change |
|---|---|---|---|---|
| New York | 1,108 | 1,600 | -492 | -30.75% |
| Florida | 950 | 629 | +321 | +51.03% |
| California | 787 | 485 | +302 | +62.27% |
| Illinois | 576 | 92 | +484 | +526.09% |
| Minnesota | 160 | 111 | +49 | +44.14% |
| Pennsylvania | 101 | 121 | -20 | -16.53% |
| Missouri | 85 | 35 | +50 | +142.86% |
| All Other States | 181 | 115 | +66 | +57.39% |
| Total ADA Lawsuits Filed | 3,948 | 3,188 | +760 |
The year-over-year pattern suggests a meaningful shift in where ADA website accessibility cases are being filed. New York remained the largest venue by volume, but its reduced share coincided with strong growth in Florida, California, and especially Illinois. Taken together, the data indicates that 2025’s national increase was driven by multiple high-activity jurisdictions rather than a single-state surge, raising the likelihood that multi-state businesses face exposure across more venues than in 2024.
Concentration shift:
Top-3 vs. Top-4 concentration (what changed structurally)
Top 3 states share fell sharply:
- 2024 (NY+FL+CA): 1,600 + 629 + 485 = 2,714 / 3,188 ≈ 85.1%
- 2025 (NY+FL+CA): 1,108 + 950 + 787 = 2,845 / 3,948 ≈ 72.1%
Top 4 states remained highly dominant because Illinois surged:
- 2024 (NY+FL+CA+IL): 2,806 / 3,188 ≈ 88.0%
- 2025 (NY+FL+CA+IL): 3,421 / 3,948 ≈ 86.7%
The largest YoY drivers of the national increase were:
- Illinois (+484) – the single largest contributor to the net increase
- Florida (+321)
- California (+302)
- Missouri (+50) and Minnesota (+49) both rose from a smaller base – meaning relative growth can look large even if totals remain modest
- All Other States (+66) increased, which is a quiet but important indicator that filings are not exclusively limited to a few named states
33 Plaintiffs Filed 50% of Total ADA Lawsuits in 2025
In 2025, filings remained highly concentrated among repeat filers. Just 33 plaintiffs filed 1,978 lawsuits (50.10%), highlighting that year-to-year shifts are often shaped by a relatively small group of high-volume filers rather than broad-based plaintiff activity.
| Plaintiff Name | Firm Name | Total Lawsuits | Percentage | Jan | Feb | Mar | Apr | May | Jun | Jul | Aug | Sep | Oct | Nov | Dec |
|---|---|---|---|---|---|---|---|---|---|---|---|---|---|---|---|
| Michael Sandoval | Manning Law, APC | 241 | 6.10% | 16 | 11 | 42 | 36 | 23 | 6 | 11 | 10 | 14 | 20 | 35 | 17 |
| Julie Dalton | Throndset Michenfelder Law Office, LLC | 131 | 3.32% | 8 | 10 | 16 | 13 | 14 | 13 | 11 | 14 | 12 | 6 | 7 | 7 |
| Perla Mageno | Manning Law, APC | 130 | 3.29% | 8 | 13 | 4 | 22 | 4 | 6 | 15 | 13 | 21 | 14 | 1 | 9 |
| Victor Ariza | Roderick V. Hannah, Esq., P.A. | 88 | 2.23% | 3 | 5 | 11 | 7 | 12 | 6 | 12 | 2 | 10 | 12 | 3 | 5 |
| Rebecca Castillo | Manning Law, APC | 85 | 2.15% | 5 | 12 | 7 | 11 | 10 | 8 | 2 | 4 | 11 | 11 | 4 | 0 |
| Robert Glen Myers | ADA Legal Team, LLC | 85 | 2.15% | 11 | 3 | 0 | 9 | 10 | 15 | 5 | 9 | 5 | 9 | 3 | 6 |
| Nelson Fernandez | Roderick V. Hannah, Esq., P.A. | 70 | 1.77% | 9 | 10 | 5 | 2 | 4 | 2 | 13 | 2 | 6 | 6 | 3 | 8 |
| Oscar Herrera | Roderick V. Hannah, Esq., P.A. | 68 | 1.72% | 10 | 0 | 12 | 11 | 2 | 2 | 9 | 1 | 6 | 9 | 0 | 6 |
| Yudy Hernandez | Adams & Associates, P.A. | 58 | 1.47% | 4 | 7 | 5 | 5 | 9 | 6 | 2 | 7 | 7 | 0 | 4 | 2 |
| Camille Winfield-Newton | AJG Law Group, PC | 56 | 1.42% | 0 | 3 | 0 | 7 | 5 | 8 | 6 | 6 | 8 | 5 | 4 | 4 |
| Joshua Espinal | Equal Access Law Group, PLLC | 54 | 1.37% | 0 | 0 | 8 | 9 | 6 | 4 | 9 | 2 | 2 | 2 | 5 | 7 |
| Alejandro Espinoza | Mendez Law Offices, PLLC | 51 | 1.29% | 5 | 1 | 6 | 3 | 3 | 0 | 4 | 1 | 7 | 9 | 5 | 7 |
| Chelette Dewees | AJG Law Group, PC | 48 | 1.22% | 0 | 0 | 0 | 8 | 9 | 11 | 0 | 2 | 4 | 8 | 1 | 5 |
| Biglang-Awa Castro Sheila | Manning Law, APC | 47 | 1.19% | 6 | 2 | 3 | 1 | 3 | 3 | 6 | 5 | 5 | 8 | 0 | 5 |
| Enrique Alvear | Roderick V. Hannah, Esq., P.A. | 47 | 1.19% | 0 | 13 | 0 | 0 | 1 | 10 | 0 | 10 | 1 | 0 | 10 | 2 |
| Abdurazak Abdu | Equal Access Law Group, PLLC | 46 | 1.17% | 0 | 0 | 12 | 10 | 9 | 4 | 11 | 0 | 0 | 0 | 0 | 0 |
| Arantza Castro | Mendez Law Offices, PLLC | 45 | 1.14% | 1 | 1 | 5 | 5 | 2 | 1 | 5 | 2 | 6 | 11 | 4 | 2 |
| Jennifer Carbine | Manning Law, APC | 43 | 1.09% | 2 | 4 | 0 | 2 | 2 | 8 | 12 | 4 | 3 | 0 | 1 | 5 |
| Andree Campbell | Aleksandra Kravets, Esq. P.A. | 43 | 1.09% | 2 | 3 | 3 | 4 | 2 | 5 | 5 | 5 | 2 | 5 | 5 | 2 |
| Nicholas Pagan | Alberto R. Leal, Esq., P.A. | 42 | 1.06% | 7 | 8 | 12 | 8 | 7 | 0 | 0 | 0 | 0 | 0 | 0 | 0 |
| Timothy Hernandez | Stein Saks, PLLC | 42 | 1.06% | 0 | 9 | 6 | 0 | 0 | 1 | 7 | 6 | 0 | 11 | 2 | 0 |
| Judith Adela Fernandez Martinez | Gottlieb & Associates | 42 | 1.06% | 0 | 0 | 0 | 0 | 10 | 0 | 5 | 10 | 9 | 8 | 0 | 0 |
| Norma O. Gazonni | Brasil & Brasil, P.A | 42 | 1.06% | 0 | 0 | 0 | 0 | 0 | 0 | 0 | 13 | 9 | 5 | 11 | 4 |
| Makeda Evans | Aleksandra Kravets, Esq. P.A. | 39 | 0.99% | 6 | 2 | 5 | 2 | 2 | 5 | 4 | 3 | 2 | 4 | 2 | 2 |
| Mykayla Fagnani | Gottlieb & Associates | 39 | 0.99% | 6 | 12 | 0 | 0 | 0 | 10 | 0 | 0 | 0 | 0 | 10 | 1 |
| Andre Battle | Horowitz Law, PLLC | 39 | 0.99% | 3 | 9 | 6 | 1 | 4 | 3 | 1 | 1 | 4 | 0 | 5 | 2 |
| Jesus Torres | Manning Law, APC | 38 | 0.96% | 2 | 7 | 0 | 2 | 4 | 0 | 5 | 9 | 5 | 4 | 0 | 0 |
| Haron Cole | Equal Access Law Group, PLLC | 38 | 0.96% | 0 | 3 | 1 | 7 | 4 | 0 | 2 | 4 | 6 | 3 | 4 | 4 |
| Zephyrin Victor | Aleksandra Kravets, Esq. P.A. | 37 | 0.94% | 3 | 3 | 2 | 4 | 7 | 3 | 2 | 2 | 2 | 2 | 5 | 2 |
| Jonathan Drummond | Aleksandra Kravets, Esq. P.A. | 36 | 0.91% | 5 | 1 | 3 | 0 | 6 | 6 | 4 | 2 | 2 | 2 | 1 | 4 |
| Erika Alexandria | Stein Saks, PLLC | 36 | 0.91% | 0 | 4 | 0 | 1 | 11 | 1 | 0 | 2 | 5 | 4 | 8 | 0 |
| Laurence Wills | Stein Saks, PLLC | 36 | 0.91% | 0 | 5 | 0 | 3 | 5 | 6 | 4 | 6 | 1 | 6 | 0 | 0 |
| Victor Lopez | Gottlieb & Associates | 36 | 0.91% | 0 | 0 | 0 | 0 | 2 | 0 | 4 | 13 | 3 | 12 | 1 | 1 |
| 33 Plaintiffs Filed 50.10% ADA Lawsuits From Jan to Dec 2025 | 1,978 | 50.10% | 122 | 161 | 174 | 193 | 192 | 153 | 176 | 170 | 178 | 196 | 144 | 119 | |
| 218 Plaintiffs Filed 49.90% ADA Lawsuits From Jan to Dec 2025 | 1,970 | 49.90% | 196 | 175 | 195 | 139 | 201 | 139 | 226 | 141 | 132 | 152 | 132 | 142 | |
| Total 251 Plaintiffs Collectively Filed 3,948 ADA Website Lawsuits From Jan to Dec 2025 | 3,948 | 100% | 318 | 336 | 369 | 332 | 393 | 292 | 402 | 311 | 310 | 348 | 276 | 261 | |
Top 5 Plaintiffs
Lawsuits: 675
Percentage: 17.10%
Top 10 Plaintiffs
Lawsuits: 1,012
Percentage: 25.63%
Top 20 Plaintiffs
Lawsuits: 1,478
Percentage: 37.44%
Top 50 Plaintiffs
Lawsuits: 2,497
Percentage: 63.25%
The highest-volume individual plaintiffs in 2025 were:
- Michael Sandoval showed the sharpest year-over-year increase, rising from 15 lawsuits in 2024 to 241 lawsuits in 2025 (+226). This scale of growth moved him from a relatively low-volume filer to the top individual plaintiff in 2025, accounting for 6.10% of all ADA website accessibility lawsuits filed that year.
- Julie Dalton (Throndset Michenfelder Law Office, LLC) – 131 (3.32%)
- Perla Mageno (Manning Law, APC) – 130 (3.29%)
- Victor Ariza (Roderick V. Hannah, Esq., P.A.) – 88 (2.23%)
- Rebecca Castillo (Manning Law, APC) – 85 (2.15%)
- Robert Glen Myers (ADA Legal Team, LLC) – 85 (2.15%)
- Nelson Fernandez (Roderick V. Hannah, Esq., P.A.) – 70 (1.77%)
- Oscar Herrera (Roderick V. Hannah, Esq., P.A.) – 68 (1.72%)
- Yudy Hernandez (Adams & Associates, P.A.) – 58 (1.47%)
- Camille Winfield-Newton (AJG Law Group, PC) – 56 (1.42%)
- Several of 2025’s other top filers increased materially versus 2024, including Julie Dalton (from 79 to 131, +52) and Perla Mageno (from 42 to 130, +88)
- Other top filers declined year-over-year, notably Victor Ariza (from 113 to 88, -25), Nelson Fernandez (from 89 to 70, -19), and Oscar Herrera (from 74 to 68, -6)
- Rebecca Castillo increased from 56 to 85 (+29)
- Robert Glen Myers increased from 35 to 85 (+50)
- Yudy Hernandez and Camille Winfield-Newton do not appear in the 2024 “Top plaintiffs” table (which bottoms out at 29 lawsuits), indicating their 2024 filings were below 29 (or not included in that top group)
16 Law Firms Filed Over 90% ADA Lawsuits in 2025
This fact shows that ADA litigation is driven by a very small and select group of people and lawyers in the US.
This section analyzes monthly filing patterns and associations with specific law firms, highlighting strategic behaviors and notable periods of inactivity. The focus is on understanding the dynamics and implications of these trends for the ADA compliance landscape.
| Plaintiff Firm Name | Total Lawsuits | Percentage | Jan | Feb | Mar | Apr | May | Jun | Jul | Aug | Sept | Oct | Nov | Dec |
|---|---|---|---|---|---|---|---|---|---|---|---|---|---|---|
| Equal Access Law Group, PLLC | 641 | 16.24% | 0 | 26 | 72 | 70 | 65 | 17 | 91 | 67 | 58 | 60 | 62 | 53 |
| Manning Law, APC | 615 | 15.58% | 39 | 52 | 57 | 75 | 51 | 36 | 58 | 48 | 62 | 57 | 43 | 37 |
| Gottlieb & Associates | 468 | 11.85% | 56 | 50 | 51 | 46 | 33 | 29 | 30 | 37 | 40 | 34 | 23 | 39 |
| Stein Saks, PLLC | 380 | 9.63% | 19 | 51 | 39 | 19 | 57 | 27 | 39 | 37 | 17 | 40 | 34 | 1 |
| Roderick V. Hannah, Esq., P.A. | 273 | 6.91% | 22 | 28 | 28 | 20 | 19 | 20 | 34 | 15 | 23 | 27 | 16 | 21 |
| NYE Stirling, Hale & Miller, LLP | 195 | 4.94% | 21 | 31 | 13 | 4 | 13 | 17 | 30 | 11 | 8 | 19 | 7 | 21 |
| Aleksandra Kravets, Esq., P.A. | 163 | 4.13% | 16 | 11 | 16 | 10 | 17 | 19 | 15 | 12 | 8 | 14 | 14 | 11 |
| Throndset Michenfelder Law Office, LLC | 158 | 4.00% | 11 | 12 | 16 | 17 | 14 | 14 | 13 | 15 | 16 | 13 | 10 | 7 |
| AJG Law Group, PC | 136 | 3.44% | 1 | 4 | 0 | 17 | 22 | 28 | 10 | 9 | 15 | 16 | 5 | 9 |
| Mendez Law Offices, PLLC | 96 | 2.43% | 6 | 2 | 11 | 8 | 5 | 1 | 9 | 3 | 13 | 20 | 9 | 9 |
| Horowitz Law, PLLC | 90 | 2.28% | 12 | 10 | 10 | 2 | 11 | 12 | 7 | 3 | 6 | 0 | 14 | 3 |
| Mizrahi Kroub LLP | 90 | 2.28% | 9 | 5 | 7 | 9 | 8 | 7 | 16 | 8 | 4 | 4 | 4 | 9 |
| ADA Legal Team, LLC | 85 | 2.15% | 11 | 3 | 0 | 9 | 10 | 15 | 5 | 9 | 5 | 9 | 3 | 6 |
| Asher Cohen PLLC | 65 | 1.65% | 49 | 16 | 0 | 0 | 0 | 0 | 0 | 0 | 0 | 0 | 0 | 0 |
| Adams & Associates, P.A. | 62 | 1.57% | 4 | 7 | 5 | 5 | 9 | 6 | 2 | 7 | 7 | 0 | 4 | 6 |
| Barros Law Firm | 50 | 1.27% | 0 | 1 | 9 | 8 | 8 | 2 | 7 | 5 | 4 | 4 | 0 | 2 |
| 16 Law Firms Filed 90.35% ADA Lawsuits in 2025 | 3,567 | 90.35% | 276 | 309 | 334 | 319 | 342 | 250 | 366 | 286 | 286 | 317 | 248 | 234 |
| 24 Law Firms Filed 9.65% ADA Lawsuits in 2025 | 381 | 9.65% | 42 | 27 | 35 | 13 | 51 | 42 | 36 | 25 | 24 | 31 | 28 | 27 |
| Total 40 Law Firms Collectively Filed 3,948 ADA Lawsuits in 2025 | 3,948 | 100% | 318 | 336 | 369 | 332 | 393 | 292 | 402 | 311 | 310 | 348 | 276 | 261 |
Top 5 Plaintiff Firms
2,377 Cases – 60.21%
Top 10 Plaintiff Firms
3,125 Cases – 79.15%
Top 16 Plaintiff Firms
3,567 Cases – 90.35%
2025 vs 2024: Plaintiff Firm Trends
(year-over-year comparison)
- Equal Access Law Group, PLLC was not among the firms highlighted in the 2024 top-firm section, but it became the leading filer in 2025, with 641 lawsuits (16.24%)
- Manning Law, APC increased substantially, from 268 lawsuits in 2024 to 615 in 2025 (+347). Its share rose from 8.41% in 2024 to 15.58% in 2025
- NYE Stirling, Hale & Miller, LLP increased from 120 in 2024 to 195 in 2025 (+75), raising share from 3.76% to 4.94%
- Throndset Michenfelder Law Office, LLC increased from 111 in 2024 to 158 in 2025 (+47), raising share from 3.48% to 4.00%
- Mizrahi Kroub LLP increased from 65 in 2024 to 90 in 2025 (+25), raising share from 2.04% to 2.28%. This figure may be understated because certain firms including Mizrahi Kroub LLP have increasingly shifted filings from federal district courts to state courts, and state-court activity is harder to track consistently across jurisdictions. As a result, the actual filing volume for these firms may differ from the totals captured here
- Horowitz Law, PLLC increased slightly from 72 in 2024 to 90 in 2025 (+18), with share essentially flat from 2.26% in 2024 to 2.28% in 2025
Several 2024 leaders declined in 2025 despite overall market growth, including:
- Stein Saks, PLLC: from 428 (2024) to 380 (2025) (-48); share from 13.43% to 9.63%
- Roderick V. Hannah, Esq., P.A.: from 309 to 273 (-36); share from 9.69% to 6.91%
- Mendez Law Offices, PLLC: from 133 to 96 (-37); share from 4.17% to 2.43%
- Gottlieb & Associates increased in volume but declined in share, moving from 417 (2024) to 468 (2025) (+51) while share fell from 13.08% in 2024 to 11.85% in 2025, reflecting the higher total filing volume in 2025
9 Industries Faced Over 90% ADA Lawsuits in 2025
| Industry Category | Total Lawsuits | Percentage | Jan | Feb | Mar | Apr | May | Jun | Jul | Aug | Sept | Oct | Nov | Dec |
|---|---|---|---|---|---|---|---|---|---|---|---|---|---|---|
| Restaurant, Food, Drinks & Beverages | 1,368 | 34.65% | 82 | 110 | 77 | 141 | 117 | 102 | 162 | 97 | 134 | 143 | 103 | 100 |
| Lifestyle, Fashion, Clothing & Apparel | 1,025 | 25.96% | 97 | 98 | 138 | 76 | 114 | 60 | 93 | 78 | 83 | 78 | 56 | 54 |
| Beauty & Personal Care | 317 | 8.03% | 38 | 20 | 35 | 32 | 24 | 30 | 28 | 25 | 17 | 27 | 17 | 24 |
| Furniture, Lighting, Home Décor & Kitchen | 303 | 7.67% | 22 | 29 | 26 | 15 | 29 | 22 | 31 | 41 | 25 | 32 | 16 | 15 |
| Health & Medical | 283 | 7.17% | 13 | 22 | 40 | 21 | 34 | 18 | 21 | 11 | 18 | 24 | 33 | 28 |
| Sports & Fitness Accessories | 89 | 2.25% | 5 | 4 | 8 | 6 | 21 | 8 | 9 | 5 | 3 | 8 | 8 | 4 |
| General Retail / Multi-Category Consumer Goods | 89 | 2.25% | 2 | 2 | 2 | 3 | 8 | 5 | 12 | 12 | 6 | 7 | 22 | 8 |
| Toys, Games, Gifts & Specialty Retail | 68 | 1.72% | 12 | 8 | 6 | 4 | 4 | 4 | 14 | 5 | 1 | 5 | 1 | 4 |
| 9 Industries Faced 91.51% of Lawsuits in 2025 | 3,613 | 91.51% | 283 | 296 | 334 | 305 | 357 | 256 | 376 | 283 | 292 | 330 | 260 | 241 |
| 10 Industries Faced 8.49% of Lawsuits in 2025 | 335 | 8.49% | 35 | 40 | 35 | 27 | 36 | 36 | 26 | 28 | 18 | 18 | 16 | 20 |
| Total ADA Website Lawsuits by Industry in 2025 | 3,948 | 100% | 318 | 336 | 369 | 332 | 393 | 292 | 402 | 311 | 310 | 348 | 276 | 261 |
Accessibility is not only a legal requirement. It is also a usability requirement. Organizations that address barriers in core user flows, navigation, forms, menus, product discovery, and checkout, typically reduce both user friction and litigation exposure.
Concentration of Lawsuits
- The top 9 industries faced 3,613 lawsuits, representing 91.51% of the 3,948 ADA website accessibility lawsuits filed in 2025
- This concentration indicates that ADA website litigation continues to focus on a narrow set of consumer-facing sectors where accessibility issues can repeatedly impact high volumes of users
Most Targeted Industry
In 2025, Restaurants, Food, Drinks and Beverages was the most targeted industry, accounting for 1,368 lawsuits (34.65%). This concentration likely reflects the sector’s heavy reliance on high-traffic, time-sensitive digital experiences such as online menus, ordering and reservations, and location finders, where accessibility failures in navigation, forms, modals, and other interactive components frequently create barriers and trigger complaints.
Other Highly Targeted Industries
- Lifestyle, Fashion, Clothing & Apparel ranked second with 1,025 lawsuits (25.96%), reflecting sustained targeting of high-traffic retail sites with complex product discovery, filtering, and checkout experiences
- Beauty & Personal Care (317 lawsuits, 8.03%), Home, Furniture & Decor (303 lawsuits, 7.67%), and Health & Medical (283 lawsuits, 7.17%) followed, showing that litigation risk remains high across industries where users must navigate large catalogs, interactive components, and essential information or service flows
Stay Updated on ADA Lawsuits!
Subscribe to our newsletter and receive the latest blog updates and ADA lawsuit reports directly to your inbox!
Nearly 25% ADA Lawsuits Filed Against Websites with an Accessibility Widget
Accessibility widgets often marketed as a quick way to improve compliance, continued to appear frequently in ADA website accessibility lawsuits in 2025. A total of 983 lawsuits were filed against websites with a widget present (24.90% of all 3,948 lawsuits), up from 722 lawsuits (22.65%) in 2024. This pattern reinforces a key point: the presence of a widget does not prevent legal action when underlying accessibility barriers remain in templates, components, and user journeys.
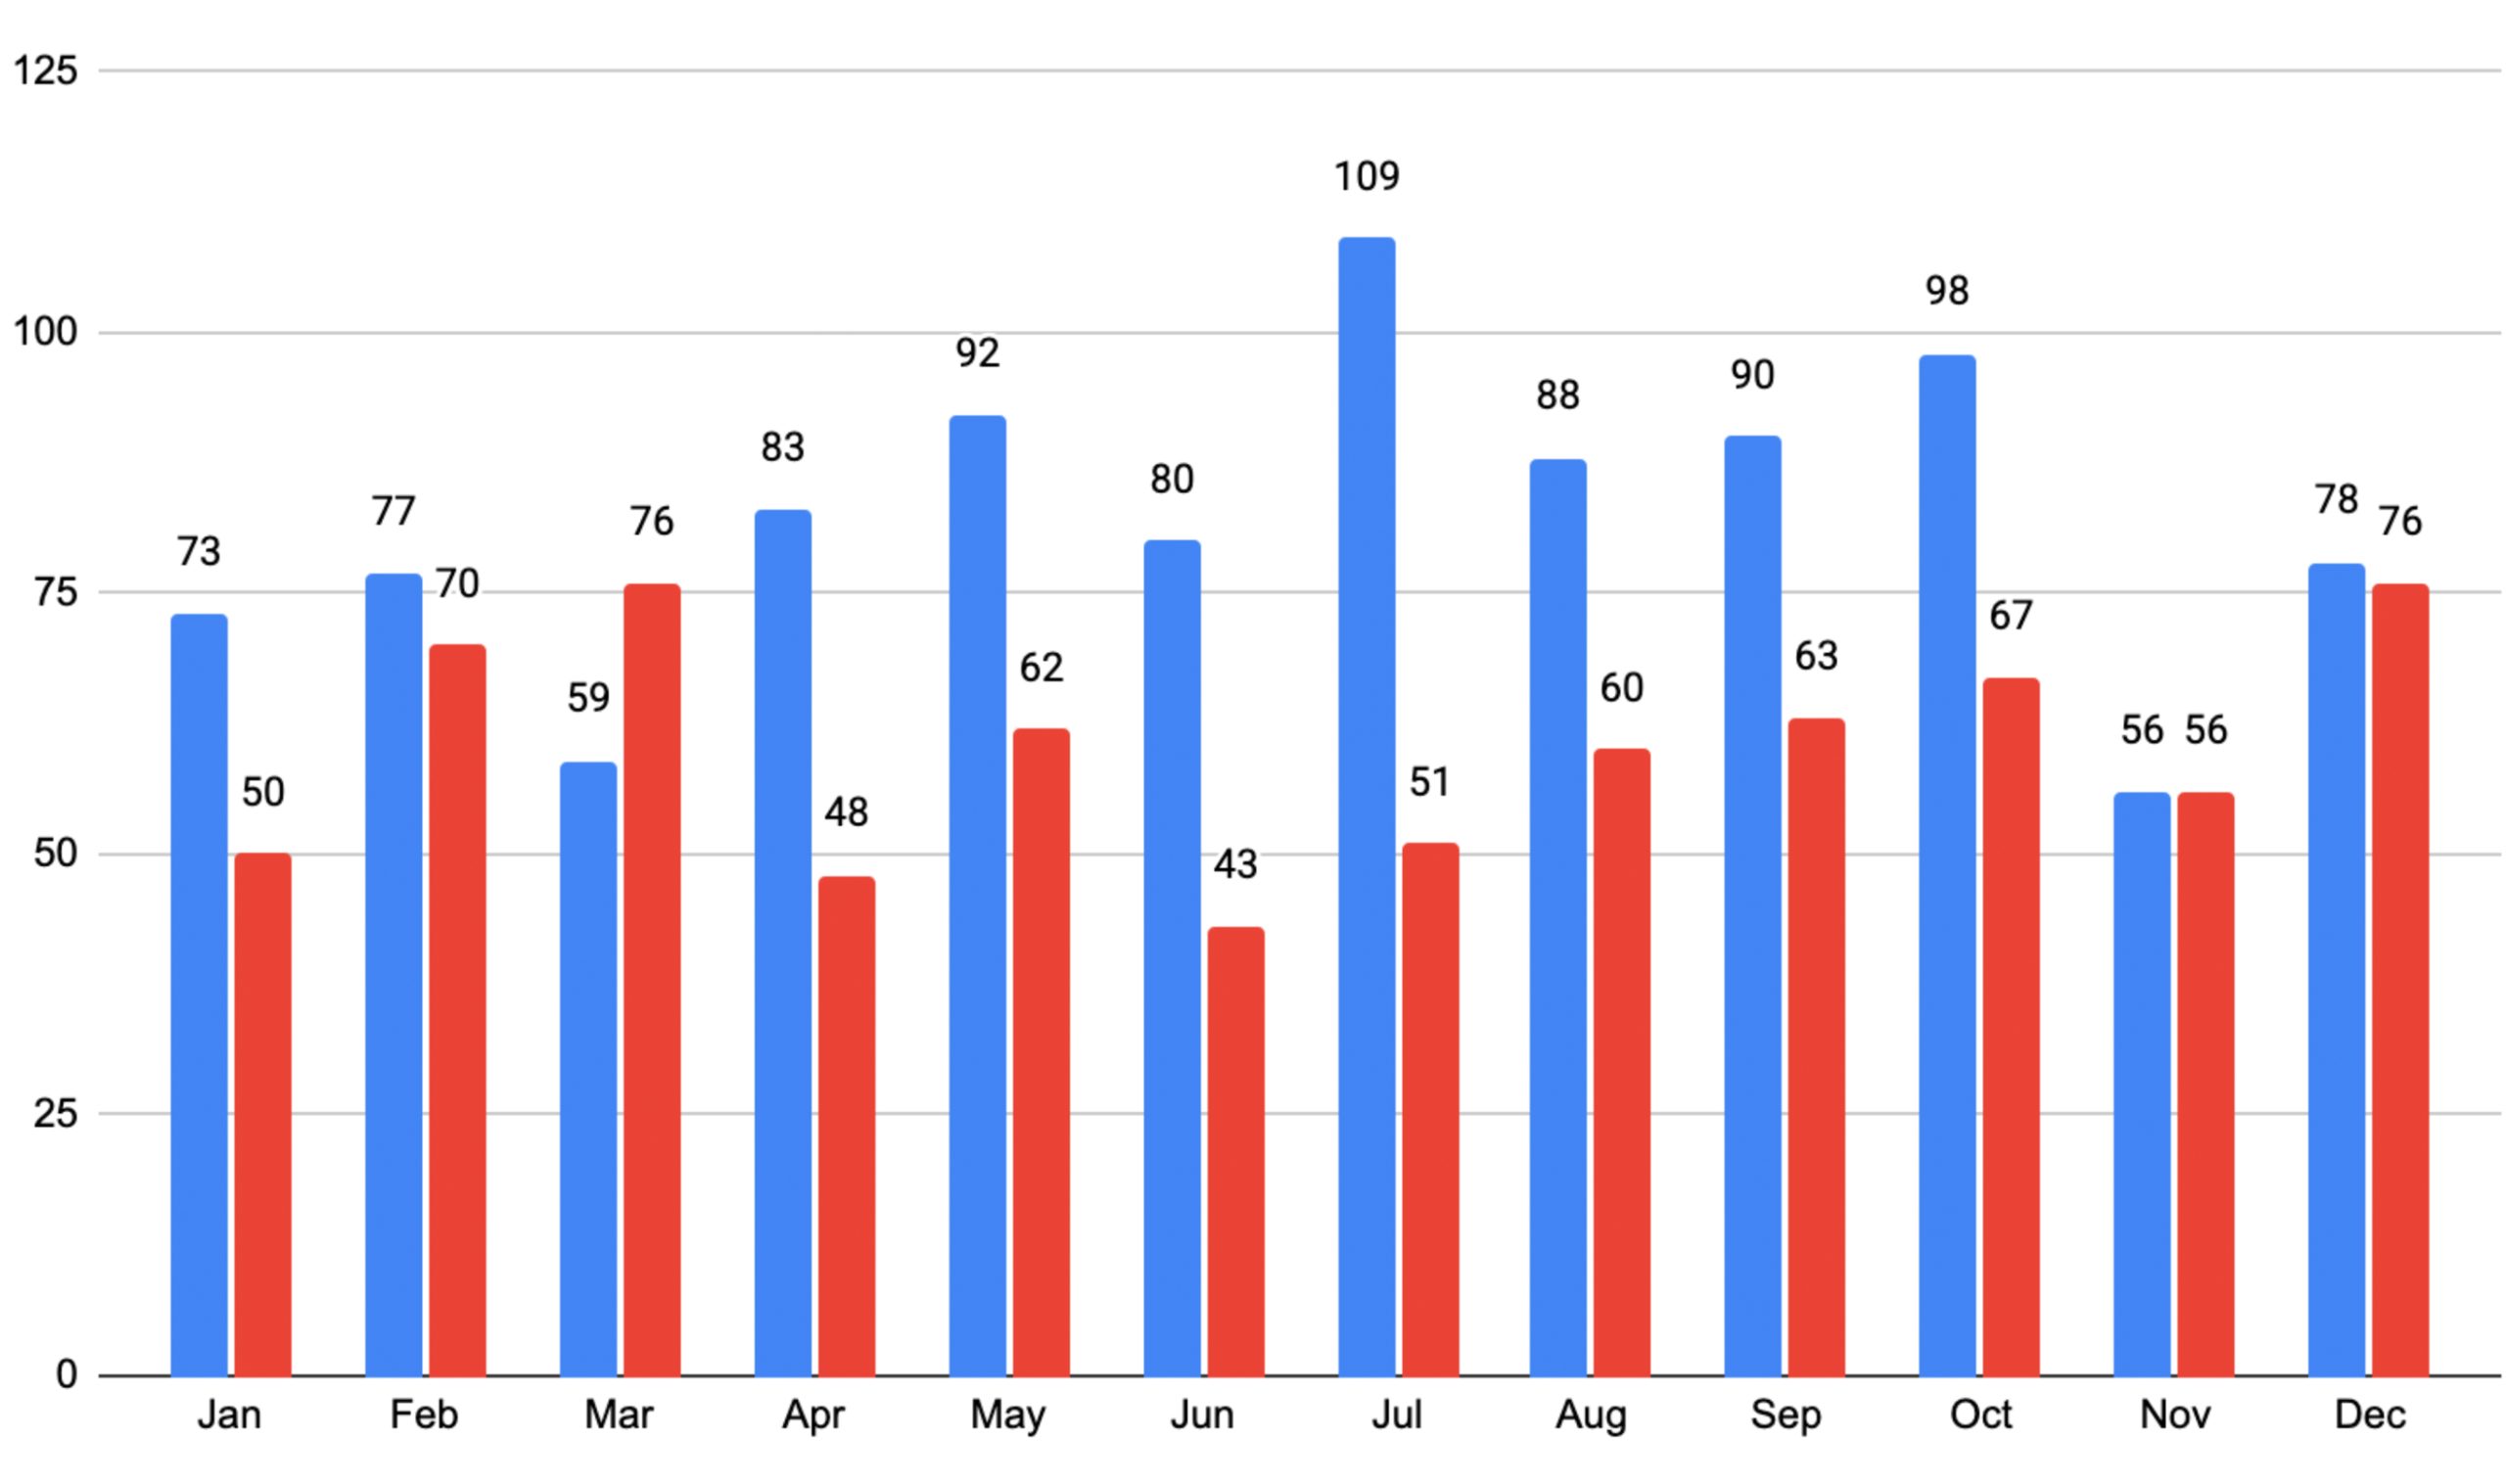
Chart Description: Monthly Comparison of ADA Website Lawsuits (2025 vs. 2024)
Lawsuits against websites using the following accessibility widgets in 2025:
AccessiBe - 424 Lawsuits
(43.13% of widget-detected lawsuits)
UserWay - 273 Lawsuits
(27.77% of widget-detected lawsuits)
AudioEye - 88 Lawsuits
(8.95% of widget-detected lawsuits)
Accessibly - 57 Lawsuits
(5.80% of widget-detected lawsuits)
UsableNet - 27 Lawsuits
(2.75% of widget-detected lawsuits)
Widget concentration (within widget-detected lawsuits)
- The top 5 widget providers accounted for 869 of 983 lawsuits (88.40%), indicating that widget-detected lawsuits are highly concentrated among a small number of vendors
Key Takeaways for Businesses
- Relying solely on widgets is risky: A widget does not replace accessible design, development, and content governance
- Marketing claims are under scrutiny: Enforcement actions related to “compliance” claims reinforce the need to validate what tools can and cannot do
- Adopt a complete accessibility approach: Combine manual auditing, WCAG-aligned remediation, and ongoing testing to reduce repeat risk, rather than treating widgets as a compliance substitute.
ADA Website Lawsuits Filed by Website Platform
Platform data is often interpreted as a “platform issue,” but accessibility outcomes are usually determined by implementation: themes and templates, custom code, third-party apps/plugins, content structure, and ongoing QA. Any platform can support an accessible experience when accessible patterns and testing are consistently applied across releases.
SHOPIFY
Shopify sites often inherit accessibility issues through theme customization, app-installed UI components, and dynamic storefront features. Risk commonly increases when key journeys, product pages, cart behavior, and checkout-related experiences are modified without accessible patterns and regression testing.
Lawsuits: 1,318
Percentage: 33.38%
WordPress
WordPress is a widely used content management system (CMS). Accessibility quality of WordPress often depends on the theme, page builder, and plugin stack. Inconsistent templates and third-party components can introduce repeat issues across navigation, forms, and content layouts when not governed by accessibility standards.
Lawsuits: 808
Percentage: 20.47%
SALESFORCE
Salesforce Commerce Cloud sites frequently involve enterprise-grade customization and integrations. Accessibility risk tends to come from custom components, personalization layers, and complex customer journeys that are not tested end-to-end with assistive technologies.
Lawsuits: 168
Percentage: 4.26%
MAGENTO
Magento (Adobe Commerce) is highly extensible, and accessibility results often depend on how themes, modules, and checkout customizations are implemented. Extensions and bespoke UI patterns can introduce barriers unless component libraries and release pipelines include accessibility checks.
Lawsuits: 156
Percentage: 3.95%
SQUARESPACE
A website building and e-commerce platform that enables businesses to create and manage websites, online stores, and digital content through an easy-to-use, all-in-one solution.
Lawsuits: 136
Percentage: 3.44%
custom-coded websites
Custom-coded sites offer full control, but outcomes vary based on process maturity. Accessibility risk typically rises when teams lack standardized components, governance for content and UI changes, and consistent QA across releases leading to regressions over time.
Lawsuits: 1,362
Percentage: 34.50%
Common Website Accessibility Issues That Commonly Lead to ADA Lawsuits
The accessibility issues cited in ADA website lawsuits are often predictable and repeat across templates. These include missing labels, low contrast, unclear controls, and keyboard barriers that block users from completing high-value actions. To help teams prioritize fixes, EcomBack has published a quick, actionable guide covering the most common ADA compliance errors and how to avoid them:

Year in Review
Key Developments Shaping Website Accessibility Risk in 2025


1. Lawsuit momentum accelerated in 2025, signaling sustained, repeat-player litigation pressure:
Mid-year tracking reported 2,019 digital accessibility lawsuits filed in the first half of 2025, with projections that filings could end nearly 20% higher than 2024 if the pace held. What stood out in 2025 was not only the volume, but the predictability of the pattern: when public enforcement feels less visible, private litigation continues to fill the gap, and plaintiffs’ strategies remain highly repeatable.
For businesses, this translated into a practical operational reality. Accessibility risk is increasingly tied to how quickly teams can identify and remediate systemic issues (navigation, forms, modals, menus, product discovery, and checkout), and how consistently those fixes are maintained across releases and third-party integrations.
2. State-court filings became more prominent, particularly in New York, which made comprehensive tracking more difficult:
A defining milestone in 2025 was the growing preference for state-level filings, particularly in New York, alongside continued activity in federal courts, with Florida remaining a major federal filing jurisdiction. This shift is especially relevant when reviewing high-volume firms such as Mizrahi Kroub, which has been widely linked to increased reliance on state-court venues in recent years.
Venue choice matters because state-court patterns can materially change risk dynamics. Timelines, procedural rules, and litigation mechanics may differ significantly from federal practice. It also affects reporting. State-court data is typically less standardized to collect and analyze at scale than federal dockets, so visibility limited to federal filings can understate actual exposure in jurisdictions where state filings are increasing.
Overall, 2025 reinforced a key lesson for digital teams. Risk monitoring should reflect where claims are being filed, not just where they are easiest to track.
3. Congress introduced H.R. 3417, adding another signal that pressure is increasing for clearer digital accessibility standards:
In May 2025, H.R. 3417 (Websites and Software Applications Accessibility Act of 2025) was introduced and referred to House committees. While the bill was introduced (not enacted), its relevance in 2025 was the policy direction it represented: continued efforts to define clearer, enforceable expectations for websites and software applications under an ADA-related framework.
For businesses, this reinforces a broader market reality. Regardless of legislative outcomes, stakeholders are pushing for more certainty, and the safest posture remains aligning to recognized accessibility standards and maintaining evidence of ongoing accessibility work.
4. FTC action elevated scrutiny of “automated compliance” marketing claims:
In April 2025, the FTC approved a final order against a provider of automated accessibility technology. The order included a $1 million payment and restrictions on unsupported marketing claims that an automated product can make a website WCAG-compliant or ensure ongoing compliance over time. For the market, this signaled that “quick compliance” positioning, especially claims framed as guaranteed WCAG conformance, carries meaningful regulatory risk.
For website owners, the 2025 takeaway is clear. Accessibility overlays and widgets may be common, but they do not replace code-level remediation, and they do not reduce litigation exposure if users continue to encounter barriers.
5. Courts continued to scrutinize standing and “cookie-cutter” complaints:
Throughout 2025, defendants increasingly challenged ADA website cases on threshold issues, particularly whether a plaintiff plausibly alleged a concrete injury and a genuine intent to use the site, rather than relying on generic, copy-and-paste allegations. Several courts signaled growing impatience with boilerplate pleadings that do not connect alleged barriers to a real attempt to complete a task such as browsing products, navigating, filling out forms, or checking out.
In Wahab v. Surya Nature, Inc. (S.D.N.Y. 2025), for example, the court described much of the amended complaint as “cut-and-paste and fill-in-the-blank” allegations commonly seen in ADA website cases and granted a motion to dismiss for lack of standing. Courts have also pointed to earlier enforcement against this pleading style, including Zinnamon v. Satya Jewelry II, LLC (S.D.N.Y. 2023), where the court sanctioned counsel for filing a complaint that failed to adequately allege standing and criticized a “cookie-cutter” approach.
For businesses, this trend does not eliminate risk. It reinforces a practical priority: accessibility programs should focus on removing functional barriers in core customer journeys, since those issues are the most likely to be alleged and the most defensible when they have been remediated and documented.
6. DOJ withdrew 11 ADA guidance documents; obligations stayed the same, but compliance communication became noisier:
In March 2025, the DOJ announced it was withdrawing 11 pieces of ADA guidance to streamline compliance resources for businesses and reduce time spent reviewing outdated material. The DOJ also highlighted tax incentives that may help offset the cost of accessibility improvements, which is a useful reminder for organizations budgeting remediation work.
In practice, the legal duty to provide accessible digital experiences did not change. What changed is that many teams lost a set of “official” explanatory materials they had relied on for internal training and decision support. As a result, 2025 reinforced the value of treating accessibility as a governed program, with documented standards, repeatable testing, clear ownership across design and engineering, and disciplined release processes, especially as the litigation environment continued regardless of the guidance reshuffle.
7. DOJ Title II update: binding digital accessibility requirements (WCAG 2.1 AA + compliance dates):
The DOJ’s Title II rule for state and local governments sets WCAG 2.1 Level AA as the technical standard for covered web content and mobile apps. The DOJ also established clear compliance deadlines based on entity size:
- April 24, 2026 for public entities serving 50,000 or more people
- April 26, 2027 for public entities serving 0 to 49,999 people and special district governments
While Title II applies to public entities, it is still a meaningful market signal: it reinforces a clear WCAG-based benchmark, and it raises expectations for vendors, contractors, and digital teams supporting government-facing or government-adjacent services.
8. WCAG update: WCAG 2.2 is now the latest WCAG 2.x standard:
WCAG 2.2 adds nine new success criteria focused on modern UX patterns, such as ensuring focus is not obscured, improving tap target size, providing alternatives to dragging-only interactions, and supporting accessible authentication and reduced redundant data entry. These updates map closely to common e-commerce friction points (sticky UI, mobile interactions, multi-step forms, and checkout experiences).
9. The European Accessibility Act became applicable on June 28, 2025, raising the bar for global digital commerce:
A major international milestone in 2025 was the European Accessibility Act (EAA) becoming applicable on June 28, 2025. For organizations that sell into the EU or provide covered digital services to EU consumers, the EAA made accessibility a direct compliance requirement, not only a litigation-driven concern.
For many e-commerce brands, 2025 marked a shift toward treating accessibility as a scalable, cross-market program supported by consistent auditing, remediation, governance, and ongoing testing, rather than a series of isolated fixes handled country by country.
Methodology
EcomBack - Your Partner in ADA Website Accessibility Compliance
EcomBack helps businesses build accessible digital experiences that reduce legal exposure and improve usability for everyone. We combine WCAG expertise, practical engineering support, and litigation-aware guidance to help organizations move from reactive fixes to a sustainable accessibility program.
What We Do
EcomBack delivers end-to-end accessibility services designed to meet real-world business needs:

Website Accessibility Audits
Identify WCAG barriers across templates, components, and high-risk user journeys (navigation, forms, product discovery, and checkout), with prioritized findings and clear remediation guidance.

Remediation & Support
Fix accessibility issues at the code level, UI components, themes, and content patterns so improvements are durable and measurable.

Accessibility Training
Enable teams to build and maintain accessible experiences through practical training for designers, developers, QA teams, and content owners.

Ongoing Monitoring & Maintenance
Keep accessibility on track with continuous testing, release support, and regression prevention as the site evolves.

PDF and Document Accessibility
Make digital documents accessible so every user can access critical information, policies, and customer-facing materials.

Accessibility Statement Support
Publish a clear accessibility statement aligned to your site’s capabilities and support process, improving transparency and user trust.
Why Businesses Choose EcomBack
- Proven, standards-based expertise grounded in WCAG and real-world implementation
- Platform-aware delivery for Shopify, WordPress, Magento, and custom builds, focused on how your stack actually behaves in production
- Proactive risk reduction through governance, testing, and accessible component patterns, not one-time fixes
- Balanced testing methods combining automated scans with manual testing and assistive technology validation

Professional Standing
These affiliations underline our credibility and expertise, ensuring your website is reviewed by industry leaders in accessibility.

International Association of Accessibility Professionals (IAAP)
Demonstrating our commitment to advancing accessibility expertise.

World Wide Web Consortium (W3C)
As part of the WCAG working group, we actively contribute to the development of global accessibility standards.

Court Approved Providers
EcomBack is a court-approved accessibility provider in a consent decree, further highlighting our recognized expertise in ensuring compliance with accessibility laws.
Free Website Accessibility Audit
EcomBack offers a free website accessibility audit to help organizations understand their current risk and next steps. The audit provides:
- A snapshot of high-impact accessibility barriers
- Practical recommendations aligned to WCAG
- Clear actions to improve user experience and reduce legal risk
Exclusive Offer
Free Website Accessibility Audit
EcomBack offers a free website accessibility audit to help organizations understand their current risk and next steps. The audit provides:
- A snapshot of high-impact accessibility barriers
- Practical recommendations aligned to WCAG
- Clear actions to improve user experience and reduce legal risk
Digital Accessibility is an Ongoing Responsibility
One that directly impacts customers, brand trust, and litigation exposure. By partnering with EcomBack, organizations can build an accessibility program that is defensible, scalable, and focused on creating equal access for all users.
Disclaimer: The contents of this report are provided for informational purposes only. The data and insights presented are based on our observations and interpretations, and while we strive for accuracy, we cannot guarantee the completeness or reliability of the information. For detailed terms and conditions regarding our content, please refer to our Website Content Disclaimer.


